Plot
? |
Symb
? |
Source
* |
Average ? |
Thresholds ? |
N_
data |
QC1
parameter |
Data
downloads |
Remarks |
| method |
value |
unit |
method |
value |
| 1 |
• | QC1DB |
none |
|
NONE |
VAL | 0.9,1.1 |
4 |
rmnrec_flag |
this |
last_yr |
all
|
SCORED: Calib_only_with FT_FINITO |
| 2 |
• | QC1DB |
none |
|
NONE |
VAL | 0.9,1.1 |
0 |
rmnrec_flag |
this |
last_yr |
all
|
Calib_science_with_FT_FINITO |
| 3 |
• | QC1DB |
none |
|
NONE |
VAL | 0.9,1.1 |
4 |
rmnrec_flag |
this |
last_yr |
all
|
Calib_only_with FT_FINITO |
| 3 |
• | QC1DB |
none |
|
NONE |
VAL | 0.9,1.1 |
3 |
rmnrec_flag |
this |
last_yr |
all
|
Calib_only_with_FT_NONE |
| |
|
*Data sources: QC1DB: QC1 database; LOCAL: local data source
|
| Plot 1 | | data source: | amber_calibrators_filtered_K
(QC1 database) |
| dataset: | rmnrec_flag | • |
| average: | none |
| fixed thresholds: | 0.9...1.1 | NONE |
| N_data plotted: | 4 |
| [click plot for closeup] |
| Plot 2 | | data source: | amber_rmnrec
(QC1 database) |
| dataset: | rmnrec_flag | • |
| average: | none |
| fixed thresholds: | 0.9...1.1 | NONE |
| N_data plotted: | 0 |
| [click plot for closeup] |
| Plot 3 | | data source: | amber_calibrators_filtered_K
(QC1 database) |
dataset:
(numbers below apply to this dataset) | rmnrec_flag | • |
| average: | none |
| fixed thresholds: | 0.9...1.1 | NONE |
| N_data plotted: | 4 |
| [click plot for closeup] |
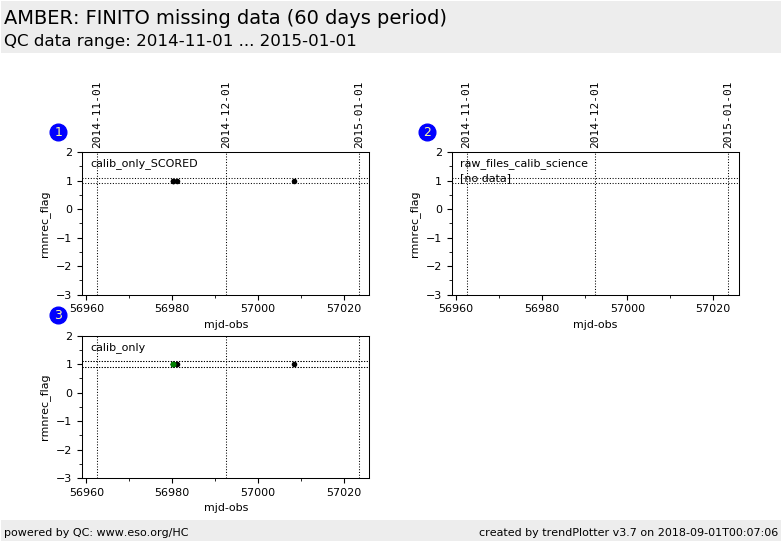
Since P88, RMNREC data are recorded in the AMBER files as a set of additionnal
tables (FNT1, FNT2, OPDC1, OPDC2)
These tables and the keyword PCR ACQ START and PCR ACQ END should be present
in the AMBER FITS files if DEL FT SENSOR is set to FINITO
and DEL FT STATUS is set to ON.
In some cases, these PCR keywords have been missing as well as the additional
tables (PPRS-042856).
The HC plot 1 and 3 shows the presence or not of these keywords and extension tables
in the calib fits files (processed by QC). The differences between plot 1 and
plot 3 is that plot 1 shows only calib with FINITO ON, plot 3 shows all calib
processed data FNT ON
(black) and FNT OFF (green).
Plot 1 is scored.
The flag can be: 1, 0:
1 : plots 1 and 3: the file is with FINITO, the keywords PCR and tables FNT and OPDC are present, plot3: file is without FNT (green points)
0 : plots 1 and 3: there is a problem with the file, PCR ACQ keywords and/or the RMNREC
tables (FNT and OPDC) are missing
The HC plot 2 shows the presence or not of these keywords and extension tables
in the raw fits files (CALIB and SCIENCE).
The flag can be: 1, 0, -1, -2 and the coding is the following:
1 : keywords PCR and tables FNT and OPDC are present
0 : keywords PCR are in the file, tables FNT and OPDC are missing
-1 : keywords PCR are missing and tables FNT and OPDC are present
-2 : keywords PCR and tables FNT and OPDC are missing
For more parameters concerning the RMNREC data (such as FNT and AMBER fluxes, optimal DIT), or concerning the observation (OBSID and target info) go to the amber_rmnrec qc1database.
General information
Click on any of the plots to see a close-up version.
The latest date is indicated on top of the plot.
If configured,
- data points belonging to the latest date are specially marked
- statistical averages are indicated by a solid line, and thresholds by broken lines
- outliers are marked by a red asterisk. They are defined as data points outside the
threshold lines
- "aliens" (= data points outside the plot Y limits) are marked by a red arrow (↑ or ↓)
- you can download the data for each parameter set if the 'Data downloads' link shows up
|
