|
|
| AMBER trending system: HISTORY report |
|
|
|
Last update: 2018-09-01T03:54:45 (UT)
|
|
|
|
|
*Date on this monitor changes at 21:00 UT |
|

|
| png: |
Information and research: |
|
- png file
|
|
|
Plot
? |
Symb
? |
Source
* |
Average ? |
Thresholds ? |
N_
data |
QC1
parameter |
Data
downloads |
Remarks |
| method |
value |
unit |
method |
value |
| 1 |
• | LOCAL |
none |
|
NONE |
none | |
379 |
bas12 |
n/a |
VIS12 |
| 2 |
• | LOCAL |
none |
|
NONE |
none | |
379 |
bas23 |
n/a |
VIS23 |
| 3 |
• | LOCAL |
none |
|
NONE |
none | |
379 |
bas31 |
n/a |
VIS31 |
| 4 |
• | LOCAL |
MEDIAN |
|
NONE |
VAL | 11,17 |
0 |
temp |
temp in VLTI lab (CAU) |
| 4 |
• | LOCAL |
MEDIAN |
|
NONE |
VAL | 11,17 |
0 |
temp |
|
| |
|
*Data sources: QC1DB: QC1 database; LOCAL: local data source
|
| Plot 1 | | data source: | local data source
|
| dataset: | bas12 | • |
| average: | none |
| thresholds: | none |
| N_data plotted: | 379 |
| [click plot for closeup] |
| Plot 2 | | data source: | local data source
|
| dataset: | bas23 | • |
| average: | none |
| thresholds: | none |
| N_data plotted: | 379 |
| [click plot for closeup] |
| Plot 3 | | data source: | local data source
|
| dataset: | bas31 | • |
| average: | none |
| thresholds: | none |
| N_data plotted: | 379 |
| [click plot for closeup] |
| Plot 4 | | data source: | local data source
|
dataset:
(numbers below apply to this dataset) | temp | • |
| median: | no data | NONE |
| fixed thresholds: | 11...17 | NONE |
| N_data plotted: | 0 |
| [click plot for closeup] |
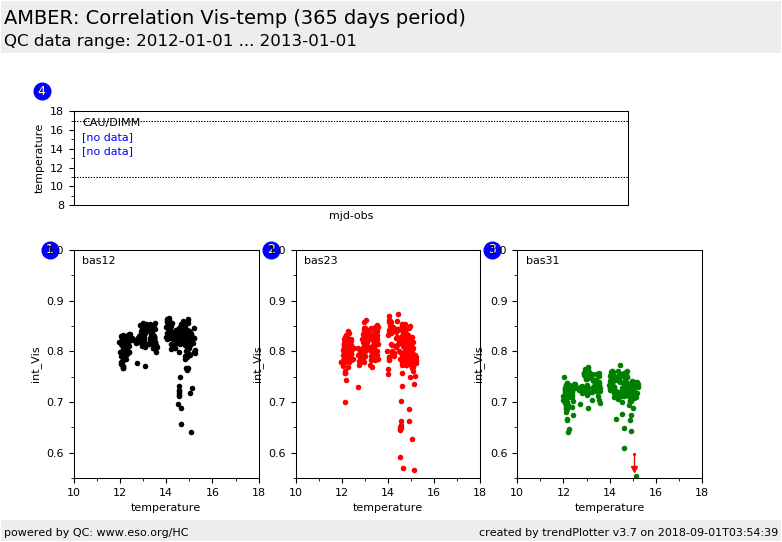
The HC plots "temp" and "IntVis_temp" are long range plots to see if
there are correlations between the Internal Visibility and the temperature
measured at the CAU. The DIMM temperature is also displayed.
General information
Click on any of the plots to see a close-up version.
The latest date is indicated on top of the plot.
If configured,
- data points belonging to the latest date are specially marked
- statistical averages are indicated by a solid line, and thresholds by broken lines
- outliers are marked by a red asterisk. They are defined as data points outside the
threshold lines
- "aliens" (= data points outside the plot Y limits) are marked by a red arrow (↑ or ↓)
- you can download the data for each parameter set if the 'Data downloads' link shows up
|