|
|
| AMBER trending system: HISTORY report |
|
Last update: 2012-02-01T08:41:04 (UT)
|
[an error occurred while processing this directive]
|
|
*Date on this monitor changes at 21:00 UT |
|

|
|
|
Plot
? |
Symb
? |
Source
* |
Average ? |
Thresholds ? |
N_
data |
QC1
parameter |
Data
downloads |
Remarks |
| method |
value |
unit |
method |
value |
| 1 |
• | QC1DB |
MEDIAN |
4.125 |
NONE |
VAL | 3.8,4.5 |
127 |
calculated_P1_offset |
this |
last_yr |
all
|
OFFSET QC P1 |
| 2 |
• | QC1DB |
MEDIAN |
3.65625 |
NONE |
VAL | 3.5,3.9 |
127 |
calculated_P2_offset |
this |
last_yr |
all
|
OFFSET QC P2 |
| 3 |
• | QC1DB |
MEDIAN |
-0.71875 |
NONE |
VAL | -1.2,-0.7 |
127 |
calculated_P3_offset |
this |
last_yr |
all
|
OFFSET QC P3 |
| |
|
*Data sources: QC1DB: QC1 database; LOCAL: local text file
|
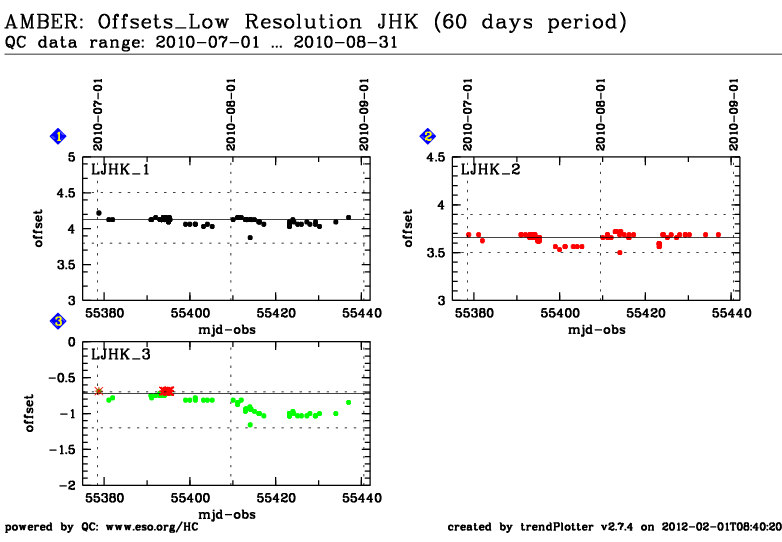
| Plot 1 | | data source: | amber_p2vm
(QC1 database) |
| dataset: | calculated_P1_offset | • |
| median: | 4.125 | NONE |
| fixed thresholds: | 3.8...4.5 | NONE |
| N_data plotted: | 127 |
| [click on plot for closeup] |
| Plot 2 | | data source: | amber_p2vm
(QC1 database) |
| dataset: | calculated_P2_offset | • |
| median: | 3.65625 | NONE |
| fixed thresholds: | 3.5...3.9 | NONE |
| N_data plotted: | 127 |
| [click on plot for closeup] |
| Plot 3 | | data source: | amber_p2vm
(QC1 database) |
| dataset: | calculated_P3_offset | • |
| median: | -0.71875 | NONE |
| fixed thresholds: | -1.2...-0.7 | NONE |
| N_data plotted: | 127 |
| [click on plot for closeup] |
Click on any of the plots to see a close-up version.
The latest date is indicated on top of the plot, data points belonging to that date are specially marked.
If configured,
- statistical averages are indicated by a solid line, and thresholds by broken lines
- outliers are marked by a red asterisk. They are defined as data points outside the
threshold lines
- "aliens" (= data points outside the plot Y limits) are marked by a red arrow (↑ or ↓)
- you can download the data for each parameter set if the 'Data downloads' link shows up
|