[page auto-refreshes after 300 sec]   [stop | on]            [press Ctrl+Shift+R to enforce refresh of scores, dates and news]
AMBER trending system: HISTORY report
HELP USERS-GUIDE MORE
Last update: 2018-09-01T04:11:30 (UT)
same group: offset_inst_LJHK offset_inst_Med offset_inst_pipe_LJHK offset_inst_pipe_Med
close window history: 2006 2007 2008   2009   2010   2011 2012 2013 2014 2015 2016 2017 2018   HEALTH FULL
  ... ... ... ... ... ... ... ... ... ...
*Date on this monitor changes at 21:00 UT
png: Information and research:
- png file - advanced studies: QC1 browser | QC1 plotter
Plot
?
Symb
?
Source
*
Average ? Thresholds ? N_
data
QC1
parameter
Data
downloads
Remarks
method value unit method value
1 QC1DB MEDIAN 3.34 NONE none  35 measured_P1_offset this | last_yr | all 
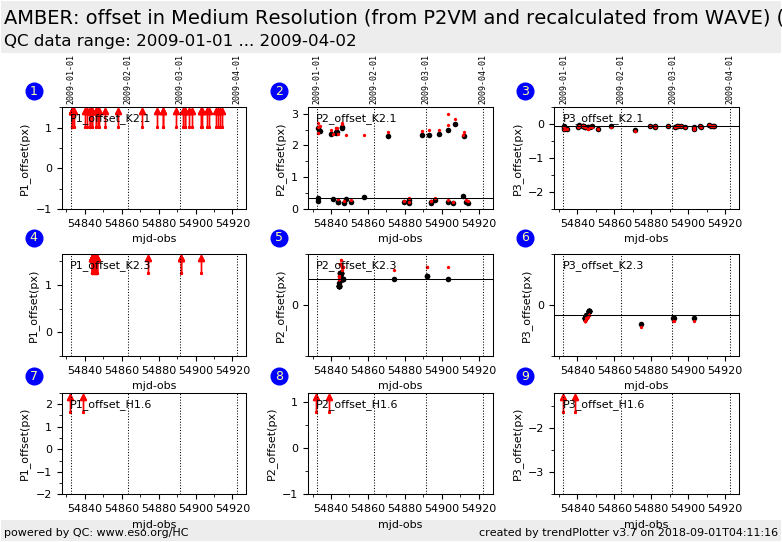
K2.1: OFFSET P1 from header
1 QC1DB none   NONE none  38 pipeline_P1_offset this | last_yr | all K2.1: OFFSET P1-Interf pipeline recalculated (px)
2 QC1DB MEDIAN 0.344 NONE none  35 measured_P2_offset this | last_yr | all K2.1: OFFSET P2 from header
2 QC1DB none   NONE none  38 pipeline_P2_offset this | last_yr | all K2.1: OFFSET P2-Interf pipeline recalculated (px)
3 QC1DB MEDIAN -0.0625 NONE none  35 measured_P3_offset this | last_yr | all K2.1: OFFSET P3 from header
3 QC1DB none   NONE none  38 pipeline_P3_offset this | last_yr | all K2.1: OFFSET P3-Interf pipeline recalculated (px)
4 QC1DB MEDIAN 2.53 NONE none  29 measured_P1_offset this | last_yr | all K2.3: OFFSET P1 from header
4 QC1DB none   NONE none  29 pipeline_P1_offset this | last_yr | all K2.3: OFFSET P1-Interf pipeline recalculated (px)
5 QC1DB MEDIAN 0.25 NONE none  29 measured_P2_offset this | last_yr | all K2.3: OFFSET P2 from header
5 QC1DB none   NONE none  29 pipeline_P2_offset this | last_yr | all K2.3: OFFSET P2-Interf pipeline recalculated (px)
6 QC1DB MEDIAN -0.0938 NONE none  29 measured_P3_offset this | last_yr | all K2.3: OFFSET P3 from header
6 QC1DB none   NONE none  29 pipeline_P3_offset this | last_yr | all K2.3: OFFSET P3-Interf pipeline recalculated (px)
7 QC1DB MEDIAN 4 NONE none  2 measured_P1_offset this | last_yr | all H1.6: OFFSET P1 from header
7 QC1DB none   NONE none  2 pipeline_P1_offset this | last_yr | all H1.6: OFFSET P1-Interf pipeline recalculated (px)
8 QC1DB MEDIAN 3.34 NONE none  2 measured_P2_offset this | last_yr | all H1.6: OFFSET P2 from header
8 QC1DB none   NONE none  2 pipeline_P2_offset this | last_yr | all H1.6: OFFSET P2-Interf pipeline recalculated (px)
9 QC1DB MEDIAN -1.05 NONE none  2 measured_P3_offset this | last_yr | all H1.6: OFFSET P3 from header
9 QC1DB none   NONE none  2 pipeline_P3_offset this | last_yr | all H1.6: OFFSET P3-Interf pipeline recalculated (px)
*Data sources: QC1DB: QC1 database; LOCAL: local data source
Plot 1
data source:amber_p2vm
(QC1 database)
dataset:
(numbers below apply to this dataset)
measured_P1_offset
median:3.34NONE
thresholds:none 
N_data plotted:35
[click plot for closeup]
Plot 2
data source:amber_p2vm
(QC1 database)
dataset:
(numbers below apply to this dataset)
measured_P2_offset
median:0.344NONE
thresholds:none 
N_data plotted:35
[click plot for closeup]
Plot 3
data source:amber_p2vm
(QC1 database)
dataset:
(numbers below apply to this dataset)
measured_P3_offset
median:-0.0625NONE
thresholds:none 
N_data plotted:35
[click plot for closeup]
Plot 4
data source:amber_p2vm
(QC1 database)
dataset:
(numbers below apply to this dataset)
measured_P1_offset
median:2.53NONE
thresholds:none 
N_data plotted:29
[click plot for closeup]
Plot 5
data source:amber_p2vm
(QC1 database)
dataset:
(numbers below apply to this dataset)
measured_P2_offset
median:0.25NONE
thresholds:none 
N_data plotted:29
[click plot for closeup]
Plot 6
data source:amber_p2vm
(QC1 database)
dataset:
(numbers below apply to this dataset)
measured_P3_offset
median:-0.0938NONE
thresholds:none 
N_data plotted:29
[click plot for closeup]
Plot 7
data source:amber_p2vm
(QC1 database)
dataset:
(numbers below apply to this dataset)
measured_P1_offset
median:4NONE
thresholds:none 
N_data plotted:2
[click plot for closeup]
Plot 8
data source:amber_p2vm
(QC1 database)
dataset:
(numbers below apply to this dataset)
measured_P2_offset
median:3.34NONE
thresholds:none 
N_data plotted:2
[click plot for closeup]
Plot 9
data source:amber_p2vm
(QC1 database)
dataset:
(numbers below apply to this dataset)
measured_P3_offset
median:-1.05NONE
thresholds:none 
N_data plotted:2
[click plot for closeup]
This plot

These plots show the offsets between P1/P2/P3 and the interferometric channel.
The values in the plots marked as "from header" (black dots) are retrieved from the headers of the P2VM HIERARCH ESO Px OFFSET (they are calculated by the instrument)
The values in the plots marked as "recalculated" (red dots and green dots) are recalculated on the WAVE raw files using the pipeline (red dots) or Antoine Merand's python script (green dots)


General information

Click on any of the plots to see a close-up version.

The latest date is indicated on top of the plot.

If configured,

  • data points belonging to the latest date are specially marked
  • statistical averages are indicated by a solid line, and thresholds by broken lines
  • outliers are marked by a red asterisk. They are defined as data points outside the threshold lines
  • "aliens" (= data points outside the plot Y limits) are marked by a red arrow ( or )
  • you can download the data for each parameter set if the 'Data downloads' link shows up