|
|
| AMBER trending system: HISTORY report |
|
|
|
Last update: 2018-09-01T03:38:55 (UT)
|
|
|
|
|
*Date on this monitor changes at 21:00 UT |
|

|
|
|
Plot
? |
Symb
? |
Source
* |
Average ? |
Thresholds ? |
N_
data |
QC1
parameter |
Data
downloads |
Remarks |
| method |
value |
unit |
method |
value |
| 1 |
• | QC1DB |
MEDIAN |
|
NONE |
VAL | 0.72,1 |
0 |
meas_int_Vis_base12 |
this |
last_yr |
all
|
VIS12_for_MH_1.65 |
| 2 |
• | QC1DB |
MEDIAN |
|
NONE |
VAL | 0.75,1 |
0 |
meas_int_Vis_base23 |
this |
last_yr |
all
|
VIS23_for_MH_1.65 |
| 3 |
• | QC1DB |
MEDIAN |
|
NONE |
VAL | 0.611,1 |
0 |
meas_int_Vis_base31 |
this |
last_yr |
all
|
VIS31_for_MH_1.65 |
| 4 |
• | QC1DB |
MEDIAN |
0.865 |
NONE |
VAL | 0.6,1 |
2 |
meas_int_Vis_base12 |
this |
last_yr |
all
|
VIS12_for_MH_1.28 |
| 5 |
• | QC1DB |
MEDIAN |
0.867 |
NONE |
VAL | 0.6,1 |
2 |
meas_int_Vis_base23 |
this |
last_yr |
all
|
VIS23_for_MH_1.28 |
| 6 |
• | QC1DB |
MEDIAN |
0.755 |
NONE |
VAL | 0.6,1 |
2 |
meas_int_Vis_base31 |
this |
last_yr |
all
|
VIS31_for_MH_1.28 |
| |
|
*Data sources: QC1DB: QC1 database; LOCAL: local data source
|
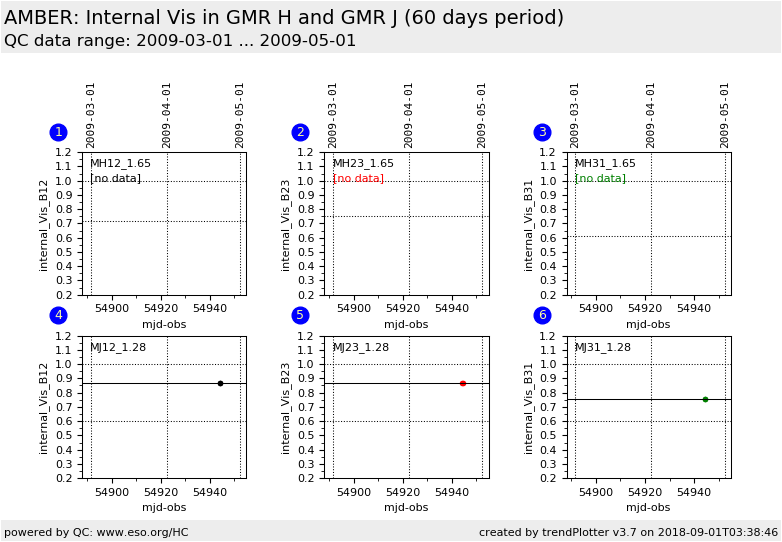
| Plot 1 | | data source: | amber_p2vm
(QC1 database) |
| dataset: | meas_int_Vis_base12 | • |
| median: | no data | NONE |
| fixed thresholds: | 0.72...1 | NONE |
| N_data plotted: | 0 |
| [click plot for closeup] |
| Plot 2 | | data source: | amber_p2vm
(QC1 database) |
| dataset: | meas_int_Vis_base23 | • |
| median: | no data | NONE |
| fixed thresholds: | 0.75...1 | NONE |
| N_data plotted: | 0 |
| [click plot for closeup] |
| Plot 3 | | data source: | amber_p2vm
(QC1 database) |
| dataset: | meas_int_Vis_base31 | • |
| median: | no data | NONE |
| fixed thresholds: | 0.611...1 | NONE |
| N_data plotted: | 0 |
| [click plot for closeup] |
| Plot 4 | | data source: | amber_p2vm
(QC1 database) |
| dataset: | meas_int_Vis_base12 | • |
| median: | 0.865 | NONE |
| fixed thresholds: | 0.6...1 | NONE |
| N_data plotted: | 2 |
| [click plot for closeup] |
| Plot 5 | | data source: | amber_p2vm
(QC1 database) |
| dataset: | meas_int_Vis_base23 | • |
| median: | 0.867 | NONE |
| fixed thresholds: | 0.6...1 | NONE |
| N_data plotted: | 2 |
| [click plot for closeup] |
| Plot 6 | | data source: | amber_p2vm
(QC1 database) |
| dataset: | meas_int_Vis_base31 | • |
| median: | 0.755 | NONE |
| fixed thresholds: | 0.6...1 | NONE |
| N_data plotted: | 2 |
| [click plot for closeup] |
Click on any of the plots to see a close-up version.
The latest date is indicated on top of the plot.
If configured,
- data points belonging to the latest date are specially marked
- statistical averages are indicated by a solid line, and thresholds by broken lines
- outliers are marked by a red asterisk. They are defined as data points outside the
threshold lines
- "aliens" (= data points outside the plot Y limits) are marked by a red arrow (↑ or ↓)
- you can download the data for each parameter set if the 'Data downloads' link shows up
|