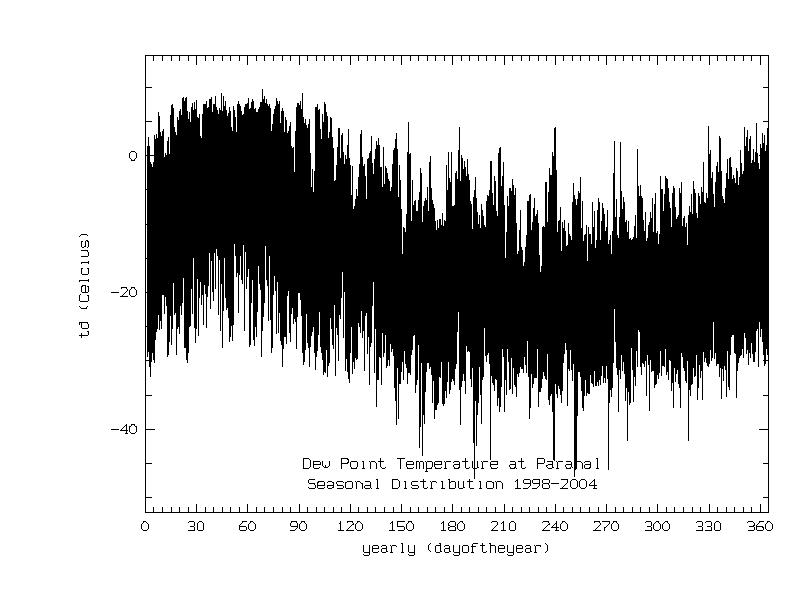
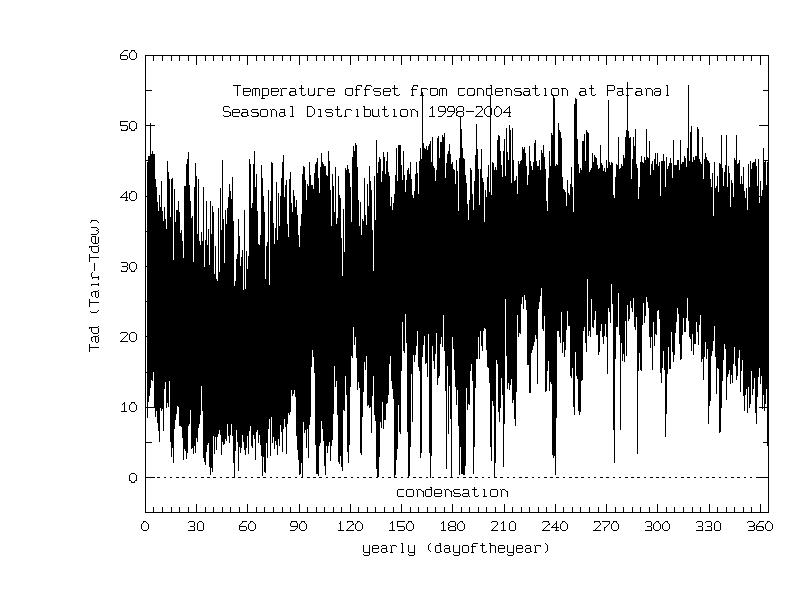
Dew-point Temperature at Paranal: Annual Statistics (Study for VLTI) Computed from 20mn Temperature and Humidity bins MinimumAverage MaximumRMS 1985-51.1-18.910.411.6 1986-48.2-18.75.511.2 1987-45.8-14.811.19.2 1988-49.0-18.73.510.7 1989-47.3-18.77.610.7 1990-48.7-19.53.99.4 1991-46.5-12.34.98.2 1993-48.4-16.93.68.8 1994-49.4-16.06.48.9 1995-47.1-17.18.69.8 1996-47.2-16.55.59.3 1997-45.3-14.510.49.3 1998-45.9-15.38.69.0 1999-46.8-15.09.09.2 2000-47.3-13.98.510.0 2001-38.4-14.09.19.7 2002-35.8-14.49.79.2 2003-40.2-16.07.57.7 2004-37.4-14.68.18.4 Dew-point Temperature at Paranal: Statistics of the difference to air temperature (1mn time resolution) from May 1998 to May 1999 (Study for VIRMOS Spectrograph).