Forecasting
Precipitable Water Vapour
and Cirrus Cloud Cover
For Astronomical Observatories:
Satellite image processing guided by synoptic model dissemination data
D. André Erasmusa and Marc Sarazinb
a South African Astronomical Observatory, P.O. Box 9, Observatory 7935, South Africa
b
European Southern Observatory Karlschwarzschildstr.2 D85748 Garching, Germany
INTRODUCTION
Astronomical observatories are extremely dependent on sky transparency. As the expensive new very large telescopes enter into operation, flexible observing modes are being introduced, which allow each 'observing block' to be scheduled at the most appropriate time. In such modes, it makes sense to develop tools for forecasting ambient conditions. We present here the operational water vapour and cirrus cloud forecast model developed for ESO observatories in Northern Chile.
Because the observatories are located well above the inversion layer, nebulosity is mainly due to high altitude cirrus clouds which have to be detected as early as possible.
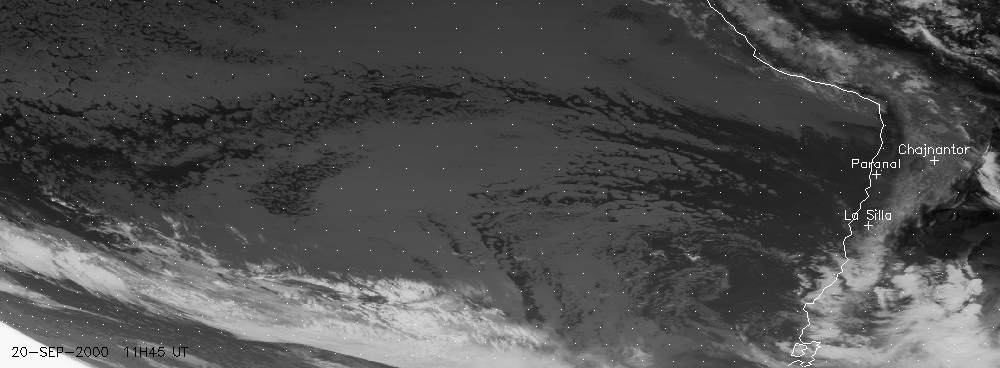
For that purpose, a model has been developed using 3-hourly GOES-8 satellite images in the water vapour channel combined with the 00UT and 12UT analyses and forecasts from the European Centre for Medium-range Forecasting (ECMWF) over a 45x30 degree area including the observatories, the Andes to the East as well as a large area of the Pacific Ocean to the West.
In the water vapour channel, radiation emitted by moisture in the middle troposphere is absorbed and re-emitted by high altitude cirrus clouds at low temperatures thus producing high (above 100%) upper tropospheric humidity (UTH) values. Empirically, UTH thresholds were determined for deciding on the presence of transparent or opaque cirrus.
A transparency index (TI) is computed if between 0% and 10% of the pixels are opaque as the average of the TI computed for the clear and transparent pixels, where:
The observatory "sky" at analysis time is defined by a circular area of about 32 km in radius centred over the site. The motion algorithm, which takes into account both the translation and the development of the pressure systems as forecasted by ECMWF, defines a movement vector that is used to determine the image areas for the forecast periods.
The motion algorithm is based on the fact that air mass motion is controlled both by translation and development of pressure systems. The 500 mb u-component of the wind is used in the forecast programme to define the west to east translation of migratory pressure systems. Development is extracted from the thermal wind shear between 700mb and 300mb.
The image pixels in the forecast areas are classified in terms of water vapour and cloudiness and attributed a weight proportional to their likelihood to cross the observatory sky in the course of a 3-hour long forecast period. We discuss the performance of the model after one year of operation, including comparisons with local sky transparency monitored from the ground in the visible part of the spectrum
.
|
.1 |
.1 |
.1 |
.1 |
.1 |
.1 |
||||||||||||||
|
.3 |
.3 |
.3 |
.3 |
.3 |
.3 |
.3 |
.3 |
||||||||||||
|
.5 |
.5 |
.5 |
.5 |
.5 |
.5 |
.5 |
.5 |
.5 |
.5 |
||||||||||
|
.7 |
.7 |
.7 |
.7 |
.7 |
.7 |
.7 |
.7 |
.7 |
.7 |
.7 |
.7 |
||||||||
|
.8 |
.8 |
.8 |
.8 |
.8 |
.8 |
.8 |
.8 |
.8 |
.8 |
.8 |
.8 |
.8 |
.8 |
||||||
|
.9 |
.9 |
.9 |
.9 |
.9 |
.9 |
.9 |
.9 |
.9 |
.9 |
.9 |
.9 |
.9 |
.9 |
.9 |
.9 |
||||
|
1 |
1 |
1 |
1 |
1 |
1 |
1 |
1 |
1 |
1 |
1 |
1 |
1 |
1 |
1 |
1 |
1 |
1 |
||
|
1 |
1 |
1 |
1 |
1 |
1 |
1 |
1 |
1 |
1 |
1 |
1 |
1 |
1 |
1 |
1 |
1 |
1 |
1 |
1 |
|
1 |
1 |
1 |
1 |
1 |
1 |
1 |
1 |
1 |
1 |
1 |
1 |
1 |
1 |
1 |
1 |
1 |
1 |
||
|
.9 |
.9 |
.9 |
.9 |
.9 |
.9 |
.9 |
.9 |
.9 |
.9 |
.9 |
.9 |
.9 |
.9 |
.9 |
.9 |
||||
|
.8 |
.8 |
.8 |
.8 |
.8 |
.8 |
.8 |
.8 |
.8 |
.8 |
.8 |
.8 |
.8 |
.8 |
||||||
|
.7 |
.7 |
.7 |
.7 |
.7 |
.7 |
.7 |
.7 |
.7 |
.7 |
.7 |
.7 |
||||||||
|
.5 |
.5 |
.5 |
.5 |
.5 |
.5 |
.5 |
.5 |
.5 |
.5 |
||||||||||
|
.3 |
.3 |
.3 |
.3 |
.3 |
.3 |
.3 |
.3 |
||||||||||||
|
.1 |
.1 |
.1 |
.1 |
.1 |
.1 |
||||||||||||||
Sample Output Message:
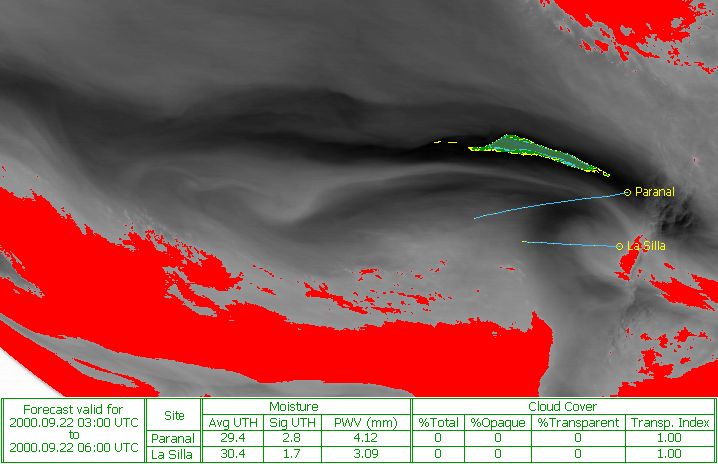
HUMIDITY AND CIRRUS CLOUD COVER FORECAST FOR PARANAL, CHILE.
Forecast period starting at 15:00 on 2000.09.20 (day 264 of 2000).
Forecast Period | HUMIDITY | CIRRUS CLOUD COVER
(UTC) | Avg UTH(%) Sig UTH PWV(mm) | %Total %Opaque %Transp. T.Index
2000.09.20 15h | 11.104 0.660 0.610 | 0 0 0 1.00
2000.09.20 15h-18h | 12.883 1.380 0.659 | 0 0 0 1.00
2000.09.20 18h-21h | 12.744 0.920 0.632 | 0 0 0 1.00
2000.09.20 21h-00h | 12.668 1.477 0.593 | 0 0 0 1.00
2000.09.21 00h-03h | 16.137 1.937 0.684 | 0 0 0 1.00
2000.09.21 03h-06h | 17.522 2.322 0.723 | 0 0 0 1.00
2000.09.21 06h-09h | 22.655 5.766 0.901 | 0 0 0 1.00
verification of the water VAPOUR forecasts
At Paranal for PWV, forecasted values were compared to observations by satellite and by an independent ground-based radiometer.
Table 1
. Root mean square differences between forecasted and observed values of PWV (mm) and UTH (%) at Paranal and La Silla. Average for all 3-hourly forecast periods out to 24 hours during the period 26 August - 31 December, 1998.|
RMS difference |
Paranal Forecast (incl. Sfc Met) |
Paranal Forecast (excl. Sfc Met) |
La Silla Forecast |
Paranal Satellite Observed |
|
Ground Monitor Observed PWV |
1.17 |
1.5 |
N/A |
1.22 |
|
Satellite Observed PWV |
0.98 |
1.58 |
1.23 |
N/A |
|
Satellite Observed UTH |
9.85 |
N/A |
10.0 |
N/A |
For the overall comparison , the eight 3-hourly forecast periods between zero and 24 hours were averaged. For Paranal, Table 1 also shows the RMS difference when the surface meteorological data are not included as input to the forecasts of PWV. Typical RMS differences between forecasted and observed values are in the 1.0-1.5mm range. This accuracy is useful for operational use of the forecasts in telescope scheduling.
verification of the CLOUD COVER forecasts (I)
The cirrus cloud cover parameters for which the forecast skill was tested are the percentage of total (opaque plus transparent) and the percentage of transparent cirrus cloud cover. Four total cirrus cloud cover (sky cover) categories were defined as follows:
Cloud Cover Category % Total cirrus cloud Fraction of sky that is clear
Clear < 25 >0.75
Mostly Clear 25-50 0.50-0.75
Mostly Cloudy 50-75 0.25-0.50
Cloudy >75 <0.25
When forecasted and satellite observed values are in the same category, a hit is counted. Neutral indicates values differ by one category and a miss by two or more categories.
Table 2. Percentage frequency of occurrence of total cirrus cloud cover forecasts classified as hit, neutral and miss. Average for all 3-hourly forecast periods out to 24 hours during the period 26 August - 31 December, 1998. Figures in parentheses exclude days that are 100% cloud free. Figures in brackets exclude days that are 100% cloud free and are for the period January 1 - June 30, 1998.
|
Site |
Hit |
Neutral |
Miss |
|
Paranal |
92.2 (55.5) |
3.7 (22.6) |
4 (21.8) |
|
La Silla |
88.8 (51.6) [63.4] |
4.1 (19.3) [15.0] |
7.1 (29.1) [21.6] |
verification of the CLOUD COVER forecasts (II)
The ground observer record consists of estimates of sky cover amount made every two hours at night between 00UT and 10UT. The cloud cover categories used by the observer are as follows:
Category Name Category No. Cloud cover criterion
Overcast 5 100% cloud cover
Very Cloudy 4 70-100% cloud cover
Cloudy 3 33-70% cloud cover
Slightly Cloudy 2 10-33% cloud cover
Clear 1 less than 10% cloud cover
The forecasts do well in distinguishing clear skies from cloudy conditions, but the amount of cloudiness being forecasted when clouds are present shows potential for improvement:
Table 3
. Comparison of Paranal cloud cover observations by ground observer and total cirrus cloud cover forecast for all days in the test period and for cloudy days only.|
Site: Paranal |
Pairs of Observations |
% Hit |
% Neutral |
% Miss |
|
All Days |
1395 |
83.3 |
5.7 |
11 |
|
Cloudy Days Only |
79 |
19.5 |
44.3 |
36.2 |
By including the 10.7 µm satellite data in the forecast so that low and middle level cloud can be detected, the number of missed cloud cover forecasts can potentially be reduced by up to about 60% (17/29).
COMPARISON OF SATELLITE DERIVED TRANSPARENCY WITH GROUND BASED ATMOSPHERIC EXTINCTION MEASUREMENTS
In the intermediate situations where the sky is not photometric but some type of astronomical observing is still possible, satellite-based forecasts of transparency would be of direct operational consequence. We seek to link the satellite-derived TI to the ground-based measurements of extinction variability with rms ranging from 0.01 to 0.1 magnitude.
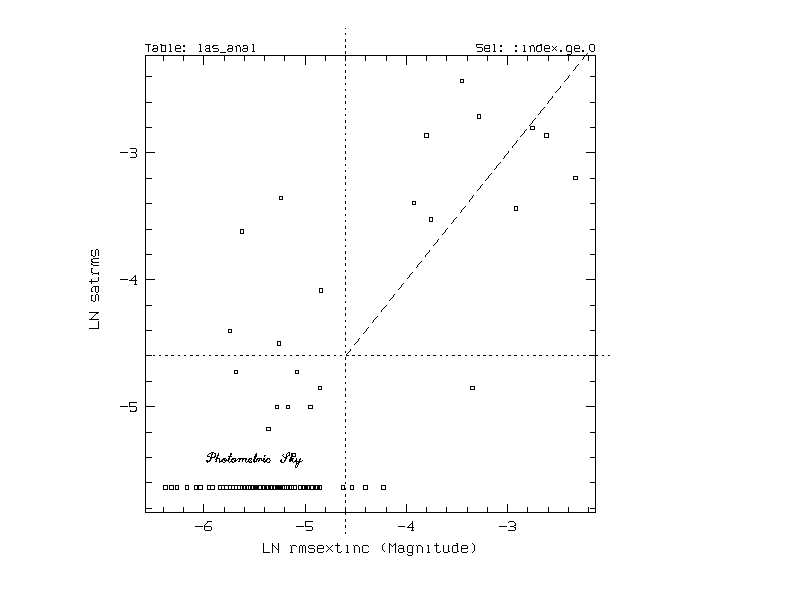
Figure 1
. Comparison of atmospheric extinction measured from the ground (x axis) with a similar parameter, Satrms = -0.1 log(TI-0.035), derived from satellite image analysis. The range of [0.01-0.1] for the rms extinction in partially cloudy sky corresponds to TIÎ [0.94-0.40].
CONCLUSION
We have demonstrated that a combination of geostationary satellite IR images with global forecasts of wind and temperature profiles can predict nighttime observing conditions at an astronomical observatory during operation.
The precipitable water vapour forecast accuracy is increased whit the real time availability of local relative humidity at ground level.
The satellite water vapour channel is adequate for detection of high altitude cloudiness. Low level clouds forecasting requires the use of thermal infrared images.
The nearly clear nighttime sky conditions can be quantified on the satellite images in terms of rms extinction experienced from the ground.
Check the ESO forecast web site:
http://www.eso.org/gen-fac/pubs/astclim/forecast/meteo/ERASMUS/