PWV forecasts for Chajnantor from the GFS model
|

|
|
| Home | Search |
|
GFS forecast compared to local measurements at the APEX radiometer
The value of the Pearson Correlation Coefficient between PWV forecasts from the GFS model (at
0, 6, 12 and 18 UTC) and the APEX radiometer measurements
from 2011 and 2012.
|


| Forecast Step |
Forecast hour (UT) |
All months |
Summer (Oct-Mar) |
Winter (Apr-Sep) |
|---|
| T+00h (analysis) |
all
00
06
12
18 |
0.84
0.86
0.84
0.81
0.84 |
0.88
0.87
0.90
0.82
0.90 |
0.86
0.86
0.87
0.87
0.87 |
| T+24h |
all
00
06
12
18 |
0.79 (0.64)
0.79
0.82
0.75
0.80 |
0.84 (0.71)
0.86
0.86
0.73
0.86 |
0.78 (0.48)
0.77
0.78
0.81
0.78 |
| T+48h |
all
00
06
12
18 |
0.75 (0.50)
0.78
0.77
0.72
0.73 |
0.81 (0.55)
0.82
0.80
0.74
0.80 |
0.69 (0.30)
0.74
0.68
0.74
0.66 |
| T+120h |
all
00
06
12
18 |
0.59 (0.28)
0.66
0.61
0.49
0.61 |
0.66 (0.29)
0.74
0.64
0.47
0.71 |
0.45 (0.12)
0.45
0.49
0.49
0.39 |
|
Ascii file description
The ascii file contains 6 columns of data that represent: [Year Month Day
and Hour of forecast initiation, Forecast step (hour), GFS forecast (mm H2O)]
|
|
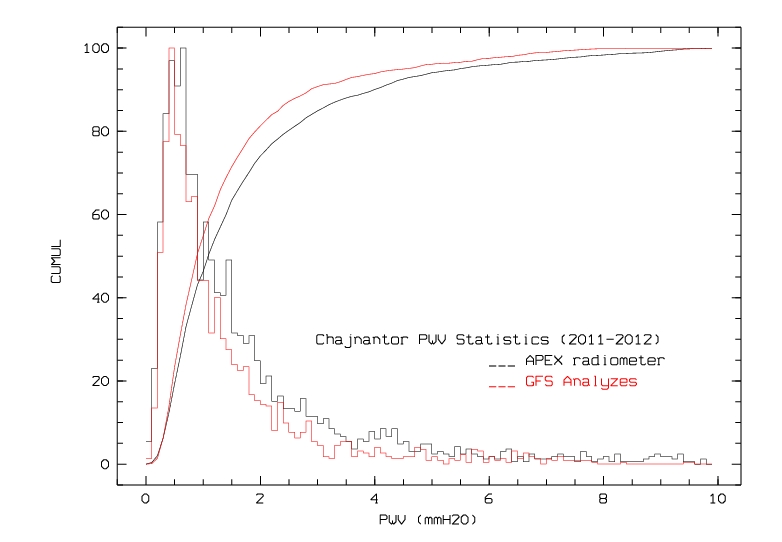
GFS analyses compared to local measurements at the APEX radiometer
PWV analyses (=forecasts at step 0) from the GFS model at
0, 6, 12 and 18 UTC are compared to the APEX radiometer measurements when available
from January to December 2012. Analyses at 00UT, enlighted in red, give the
best agreement. The best linear fit, as well as the value of the Pearson Correlation Coefficient
are given in the graphs.
|
 All Data All Data
 Summer Summer
 Winter Winter
|
|
|
|
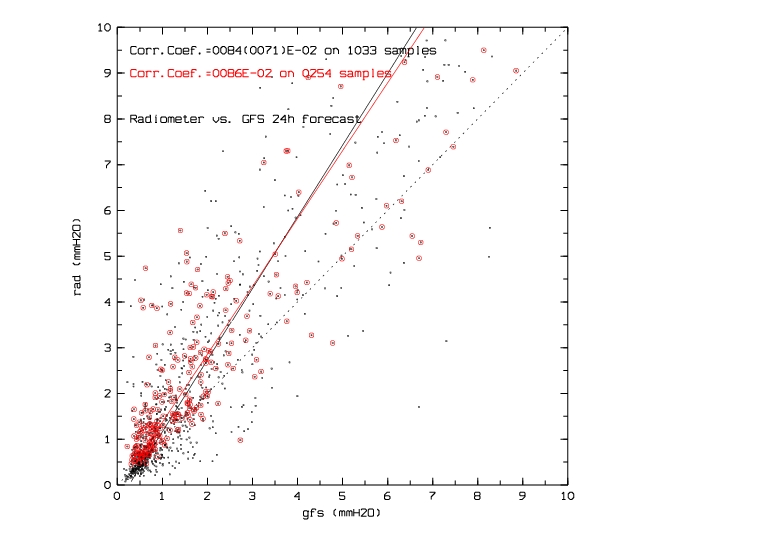
GFS 24h forecasts compared to local measurements at the APEX radiometer
Same as above but for PWV forecasts at step 24h from the GFS model.
In parenthesis is shown for comparison the correlation coefficient without prediction, i.e. assuming PWV equal to its value at the time of analysis (persistence).
|
 All Data All Data
 All Data, Kalman All Data, Kalman
 Summer Summer
 Winter Winter
|
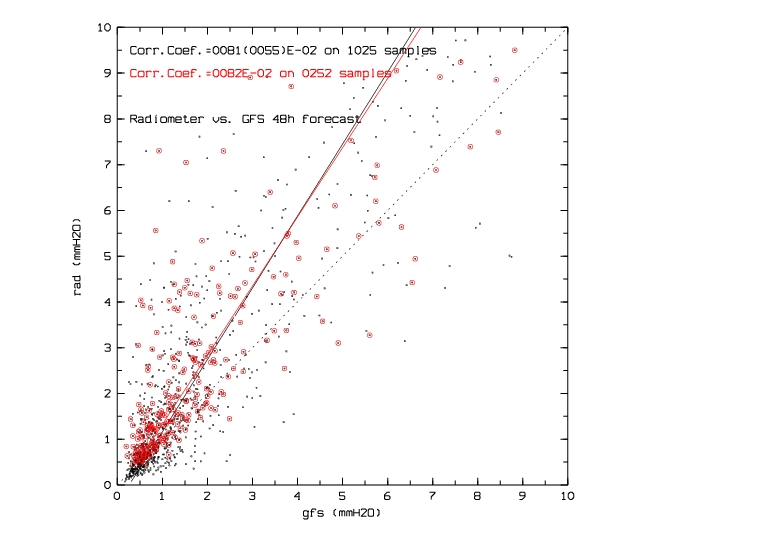
GFS 48h forecasts compared to local measurements at the APEX radiometer
Same as above but for PWV forecasts at step 48h from the GFS model.
In parenthesis is shown for comparison the correlation coefficient without prediction, i.e. assuming PWV equal to its value at the time of analysis (persistence).
|
 All Data All Data
 Summer Summer
 Winter Winter
|
GFS 120h forecasts compared to local measurements at the APEX radiometer
Same as above but for PWV forecasts at step 120h.
In parenthesis is shown for comparison the correlation coefficient without prediction, i.e. assuming PWV equal to its value at the time of analysis (persistence).
|
 All Data All Data
 Summer Summer
 Winter Winter
|