| This documentation is intended both for QC scientists and SciOps astronomers (who may want to ignore the technical information displayed in grey). | ||||||||||||||||||||||||||||
|
||||||||||||||||||||||||||||
|
||||||||||||||||||||||||||||
| bottom plots | contact | ||||||||||||||||||||||||||||
| NAME | bias.prg | |||||||||||||||||||||||||||
| VERSION |
1.0 -- adapted from UVES (May 2003) 1.1 -- P3 replaced by DISPLAY variable Y/N (2006-04-18) | |||||||||||||||||||||||||||
| SYNTAX | MIDAS | |||||||||||||||||||||||||||
| CALL | processQC -a ab_name | |||||||||||||||||||||||||||
| INSTRUMENT | GIRAFFE | |||||||||||||||||||||||||||
| RAWTYPE | BIAS | |||||||||||||||||||||||||||
| PURPOSE | compares raw and product BIAS files for FLAMES/GIRAFFE QC assessment; the plots are later reviewed within certifyProducts. The first plot (bias1.gif) is stored in $DFO_PLT_DIR. | |||||||||||||||||||||||||||
| PROCINPUT |
first raw BIAS from AB; MASTER_BIAS product; BAD_PIXEL_MAP | |||||||||||||||||||||||||||
| QC1TABLE |
trending | table(s) in QC1 database: giraffe_bias | |||||||||||||||||||||||||||
| TRENDPLOT |
trending | HealthCheck plot(s) associated to this procedure: trend_report_BIAS_HC.html | ../FULL/trend_report_BIASFULL.html | |||||||||||||||||||||||||||
| QC1PAGE |
trending | associated documentation: bias_qc1.html | |||||||||||||||||||||||||||
| QC1PLOTS top |
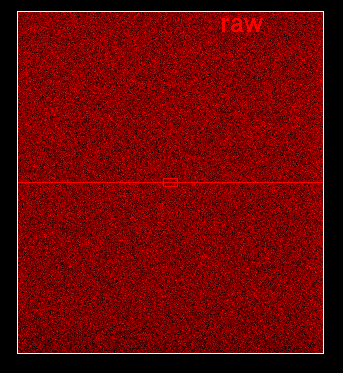
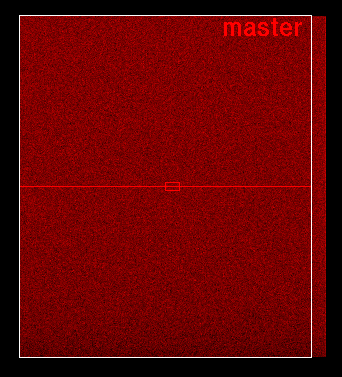
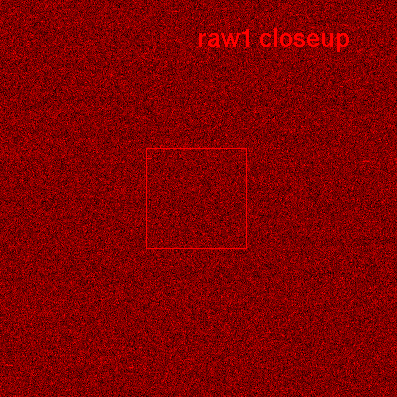
bias1.gif box1: comparison master (red) <-> raw (black); upper panel: middle row and middle column, full pixel range, in ADU; lower panel: middle row and middle column, central 100 pixels, in ADU box 2: structure description; all columns (top) and all rows (bottom) are collapsed and displayed; box 3: histogram: all pixel values in log frequency histogram; raw: black, master: red (note: was the other way round before 2009-07-21); there should be a dominant peak with Gaussian shape (which translates to parabola shape in this log freq diagram), and the parabola for the master should be narrower than the one for the raw file. top panel: name of analyzed master bias frame bottom panel: some QC1 parameters (median_master; raw RON, master RON, expected RON=raw/sqrt(5), structure parameters) bias2.png full display of raw frame (box: area to be displayed in bias4.png) bias3.png full display of master frame (box: area to be displayed in bias5.png) bias4.png closeup display of raw frame (box: 100x100 pixel window used to derive RON) bias5.png closeup display of master frame (box: 100x100 pixel window used to derive RON) | |||||||||||||||||||||||||||
| QC1PARAM |
QC1 parameters written into QC1 table: QC1db names: datancom | median_master | sigma_raw | sigma_master | struct_row | struct_col FITS key names: DATANCOM | (bias.prg) | OUT1.RON.RAW | OUT1.RON.MASTER | (bias.prg) | (bias.prg) QC1 params created by pipeline: all | |||||||||||||||||||||||||||
| ALGORITHM |
Description of algorithms: sigma_master: statistics (std_dev) in central window X1024..1124, Y1998..2098 (MIDAS: stat/ima, bins=1, outputr(4)) sigma_raw: statistics (std_dev) in central window X1024..1124, Y1998..2098 (MIDAS: stat/ima, bins=1, outputr(4)) median_master: statistics (median) of full frame (MIDAS: stat/ima, bins=0.1, exc=100,300) struct_row/col: average/row or col; statistics with exc=mean+/-2 ADU; struct_row/col is the std_dev | |||||||||||||||||||||||||||
| CERTIF |
Reasons for rejection: - unusually high bias level or RON level (unless representative); - unusual structure (compare panel 2 plots with older/reference version); - non-Gaussian shape of histogram; - DATANCOM lower than usual (5), especially if N=5 version nearby in time The closeup displays are useful to check for patterns (pick noise) which should not be there. | |||||||||||||||||||||||||||
| COMMENTS |
Some QC parameters are calculated by the pipeline. All pipeline-provided QC1 parameters are documented in the pipeline users manual (as of issue 2, 2007-12-28) | |||||||||||||||||||||||||||
| top | [2015-10-29T10:06:15] created by qcDocu v1.1.2, a tqs tool | |||||||||||||||||||||||||||